


The field of financial modeling has emerged as a critical discipline in finance and decision-making for businesses, playing a pivotal role in analyzing complex financial scenarios, forecasting outcomes, and supporting strategic decision-making processes.
With the increasing availability of data, advancements in computational power, and evolving financial markets, the practice of financial modeling has gained significant attention from stakeholders, investors and financial analysts.
This comprehensive guide explores the various uses of financial models, presents real-world examples to illustrate their practicality, and discusses best practices for success in implementing financial modeling techniques. By the end of this guide, you’ll have the knowledge and tools to excel in the realm of financial modeling and drive informed decision-making in diverse business contexts.
What is Financial Modeling?
A financial model is a forecast of a company’s financial statements, usually created in a spreadsheet. It provides a dynamic projection of the company’s financial performance over a specific period, typically ranging from five to ten years. Financial modeling helps us understand and plan for how the company’s finances may evolve in the future.
Financial modeling typically incorporates past or historical information as a basis for analysis. Historical financial data, such as income statements, balance sheets, and cash flow statements, are often used to build the foundation of a financial model.
This data provides insights into the company’s performance and trends over time, allowing analysts to identify patterns, assess historical growth rates, and understand the impact of various factors on financial metrics.
With a financial model, we can analyze different scenarios and assess the potential impacts of various decisions on the company’s financial health. By manipulating the assumptions and variables within the model, we can simulate changes in revenue, expenses, investments, and other factors to gauge their effects on profitability, cash flow, and overall financial viability.
How does this help?
By incorporating both historical information and forward-looking assumptions, financial modeling enables us to make more informed decisions about resource allocation, investment opportunities, capital structure, and strategic planning. It also aids in evaluating the risks and uncertainties associated with different courses of action, providing valuable insights to support effective financial management and strategic decision-making.

What is Financial Modeling Used For?
Financial modeling is used for a variety of purposes across different industries and sectors. Below we explore some of the important use cases like financial planning and risk management.
Investment & Risk Analysis
Financial models play a crucial role in investment analysis by evaluating the potential returns and risks of investment opportunities. These models help investors and portfolio managers make informed decisions about which investments to pursue, how to allocate their resources, and how to manage their portfolios effectively.
By considering various factors such as historical performance, market trends, and risk indicators, financial models enable individuals and organizations to assess the attractiveness of investment opportunities and align their investment strategies with their financial goals.
Valuation
Models are widely used to determine the value of assets, companies, or projects. In the context of mergers and acquisitions, financial models help estimate the fair value of a target company, evaluate the potential integration benefits, and determine the appropriate purchase price.
Similarly, in initial public offerings (IPOs) or private placements, financial models aid in valuing the company’s shares or securities, providing insights for pricing and negotiation. Financial models support informed decision-making in transactions and strategic initiatives by employing various valuation techniques, such as:
- discounted cash flow analysis
- comparable company analysis
- asset-based approaches
Financial Planning and Budgeting
Financial models are instrumental in creating comprehensive financial plans and budgets. These models project revenues, expenses, and cash flows based on assumptions and historical data, providing a forward-looking view of the company’s financial performance.
By incorporating different scenarios and sensitivity analysis, financial models help organizations anticipate potential challenges and identify opportunities for improvement. These enable effective financial management by setting financial targets, executing resource planning, including capacity planning, monitoring performance, and facilitating decision-making based on reliable financial information.
Forecasting
Financial models provide forecasts of future financial performance, enabling organizations to plan and allocate resources effectively. These models take into account historical data, market trends, and relevant variables to project future revenues, expenses, and cash flows.
By analyzing the projected financial outcomes, businesses can make informed decisions about product development, market expansion, cost control measures, and overall strategic planning. Financial forecasting helps organizations anticipate potential risks and opportunities, align their resources, and adapt their strategies to changing market conditions.
Scenario Analysis
Financial models allow for scenario analysis, which involves testing different hypothetical scenarios and assessing their impact on financial outcomes. By varying key assumptions, such as market conditions, pricing strategies, or cost structures, financial models provide insights into the potential outcomes under different scenarios.
This helps organizations:
- assess the robustness of their financial plans
- identify potential risks and vulnerabilities
- develop contingency plans
Scenario analysis enables decision-makers to evaluate different courses of action, make risk-informed decisions, and enhance their strategic planning processes.
Risk Management
Financial models play a vital role in assessing and managing financial risks. By incorporating risk factors and simulating their impact on financial outcomes, these models help organizations identify potential risks, quantify their potential impact, and develop risk mitigation strategies.
Financial models allow for stress testing, scenario analysis, and sensitivity analysis to evaluate the resilience of the company’s financial position under adverse market conditions. By assessing risk exposures and evaluating risk-return trade-offs, financial models enable organizations to make informed decisions that optimize risk-adjusted returns and ensure the business’s financial stability.
Financing Decisions
Financial models assist in evaluating different financing options and determining the most suitable and cost-effective sources of funding. Whether considering debt financing, equity financing, or hybrid structures, financial models help organizations assess the financial implications, such as interest costs, repayment schedules, dilution of ownership, and overall capital structure.
These models consider factors such as interest rates, terms of financing, and projected cash flows to estimate the cost and impact of different financing alternatives. By comparing and analyzing different scenarios, financial models support decision-making processes related to financing, ensuring optimal capitalization and financial sustainability.
Sensitivity Analysis
Financial models allow for sensitivity testing by varying key assumptions to assess the sensitivity of financial outcomes to changes in variables, such as interest rates, exchange rates, or input costs. Sensitivity analysis helps organizations understand the impact of different factors on financial results and identify potential areas of vulnerability.
By assessing the sensitivity of financial outcomes to changes in key variables, financial models assist in managing risks, developing contingency plans, and making informed decisions that account for potential fluctuations in market conditions.
Importance of Financial Models
Financial models are crucial in finance and business as these enable organizations to make informed decisions, manage risks, plan for the future, and communicate effectively with stakeholders. By providing a quantitative framework to analyze financial data, such models bring objectivity and consistency to the decision-making process.
By removing subjective biases and offering a structured approach to evaluating options, these minimize potential errors or biases that may arise from relying solely on qualitative assessments.
Moreover, financial models serve as reliable tools to assess the financial impact of strategies, initiatives, and market conditions. These ensure that decisions are based on rigorous analysis and factual evidence, enhancing the credibility of the decision-making process and instilling confidence among stakeholders.
Financial models also play a crucial role in change management, providing a quantitative framework to evaluate the financial implications of organizational changes. By incorporating different scenarios and variables, financial models help assess the potential risks and benefits associated with changes in business operations, market dynamics, or strategic direction.
This enables organizations to make informed decisions, effectively manage the financial aspects of change, foster a smoother transition, and maximize the likelihood of desired outcomes.
Investors, lenders, and board members rely on accurate and well-supported financial projections and assessments, including those related to change management, to guide their actions and investments.
Who Uses Financial Modeling?

Financial modeling is a valuable tool utilized by various individuals and entities across different sectors and industries. The following are some key stakeholders who commonly rely on financial modeling:
Financial Analysts
Financial analysts use these models extensively to analyze data, evaluate investment opportunities, perform valuation exercises, and generate insights for decision-making.
Investment Bankers
Investment bankers employ financial modeling to support merger and acquisition (M&A) activities, initial public offerings (IPOs), and other corporate finance transactions.
Corporate Finance Professionals
Professionals working in corporate finance departments utilize financial models for budgeting, forecasting, and strategic planning purposes.
Portfolio Managers
Portfolio managers rely on financial models to construct and manage investment portfolios.
Risk Managers
Risk managers utilize financial models to assess and manage risks across the organization.
Chief Financial Officers (CFOs)
CFOs play a vital role in financial decision-making within organizations. They rely on financial models to develop financial strategies, analyze the financial implications of business initiatives, and provide guidance on capital allocation.
Entrepreneurs and Startups
Entrepreneurs and startup founders use financial models to assess the financial feasibility of their business ideas and secure funding from investors. These models help in projecting revenues, estimating expenses, and analyzing profitability.
Financial Consultants and Advisors
Financial consultants and advisors utilize financial models to provide strategic advice to clients.
Regulatory Authorities
Regulatory authorities rely on financial models to assess the financial health and stability of financial institutions.
Academics and Researchers
Academics and researchers in the field of finance use financial models to study financial markets, investment strategies, and risk management techniques.
Examples of Financial Models
In this section, we’ll explore different examples of financial models that are commonly used across industries. Each type of model serves a specific purpose and offers unique insights into the financial aspects of a business.
From discounted cash flow (DCF) models to mergers and acquisitions (M&A) models, we’ll delve into the key features and applications of these financial models, showcasing their significance and contribution to effective financial decision-making and analysis. Here are 6 common types of financial models:
Three-Statement Model
- The three-statement model is a fundamental financial modeling technique widely used by professionals in finance and accounting.
- It provides a comprehensive view of a company’s financial performance, projecting its income statement, balance sheet, and cash flow statement.
- By integrating these three essential financial statements, the model offers valuable insights into a company’s operations, financial health, and cash flow dynamics.
Now let’s understand these statements one by one.
The Income Statement
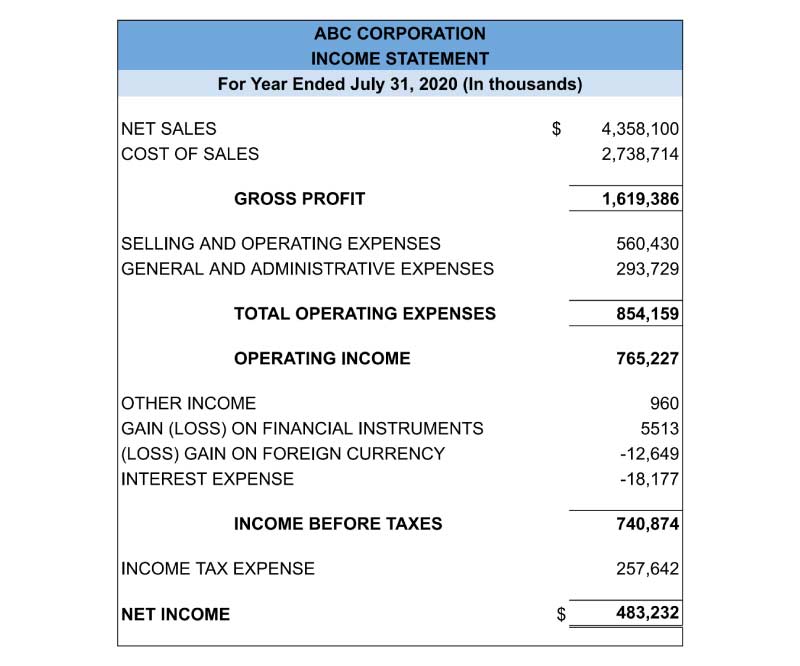
The first component of the model is the income statement, also known as the profit and loss statement (P&L). This statement provides a summary of a company’s revenues, expenses, and profits over a specific period. It showcases the company’s ability to generate revenues, control costs, and ultimately generate profits or net income.
The Balance Sheet
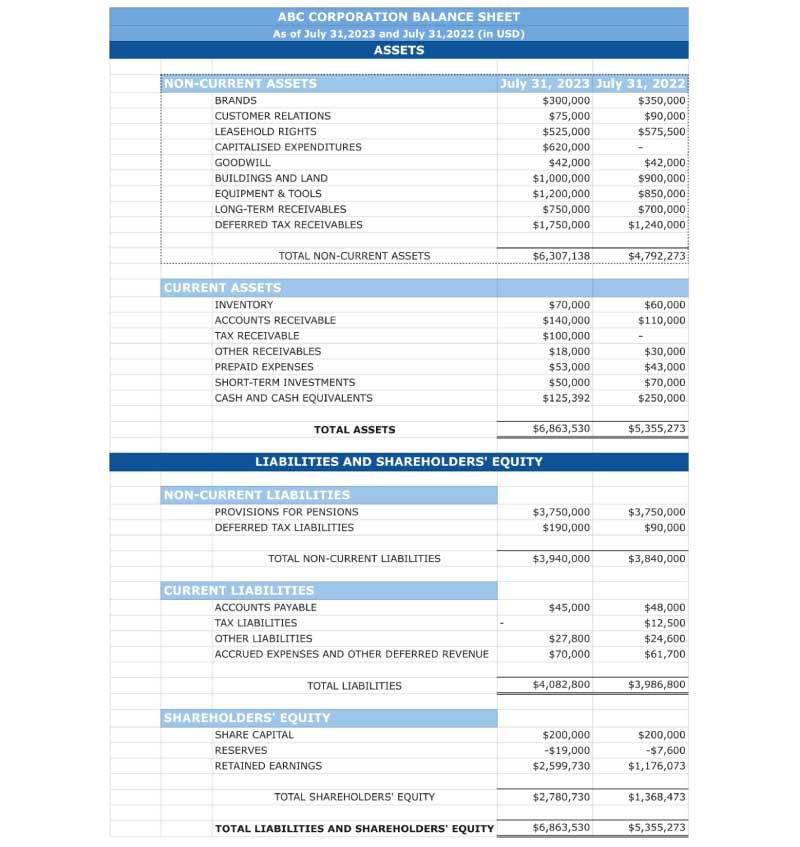
The second component of the model is the balance sheet. It presents a snapshot of a company’s financial position at a specific point in time, detailing its assets, liabilities, and shareholders’ equity. The balance sheet highlights the company’s resources (assets) and how they’re financed (liabilities and equity).
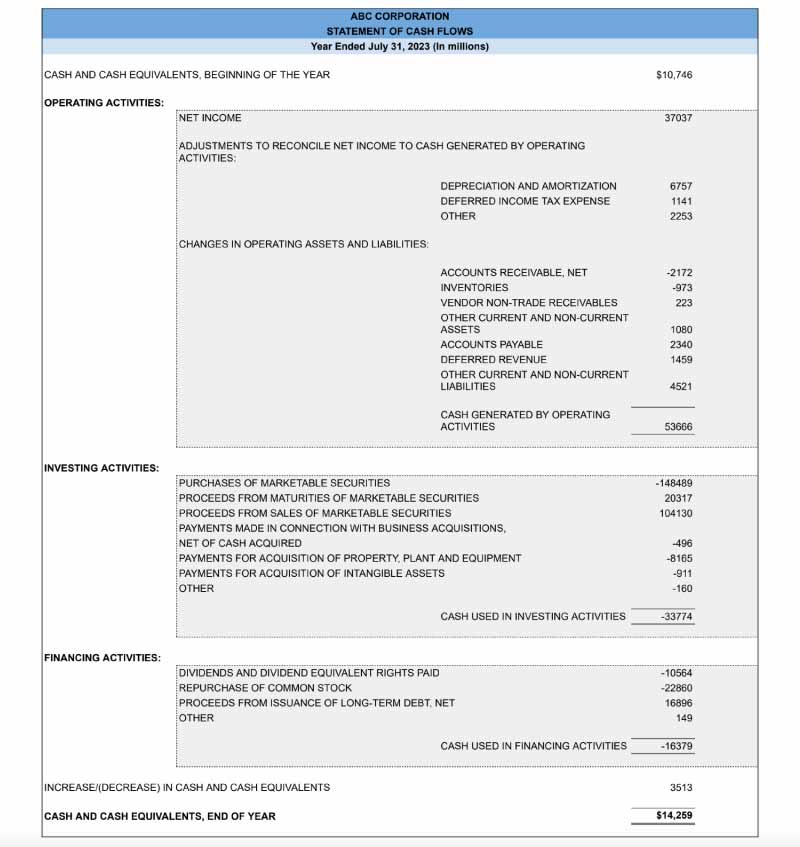
The Cash Flow Statement
The third component of the model is the cash flow statement. This statement provides an overview of a company’s cash inflows and outflows during a given period. It classifies cash flows into three categories:
- operating activities
- investing activities
- financing activities
The cash flow statement helps stakeholders understand the company’s ability to generate and manage cash, evaluate its investment decisions, and assess its financing activities.
- Building a three-statement model involves integrating these three financial statements, ensuring that they’re internally consistent and reflect accurate financial information.
- The model requires careful consideration of various assumptions, such as revenue growth rates, cost structures, working capital changes, capital expenditures, and financing activities.
- It also incorporates important financial ratios and metrics, such as gross margin, operating margin, return on equity (ROE), and free cash flow.
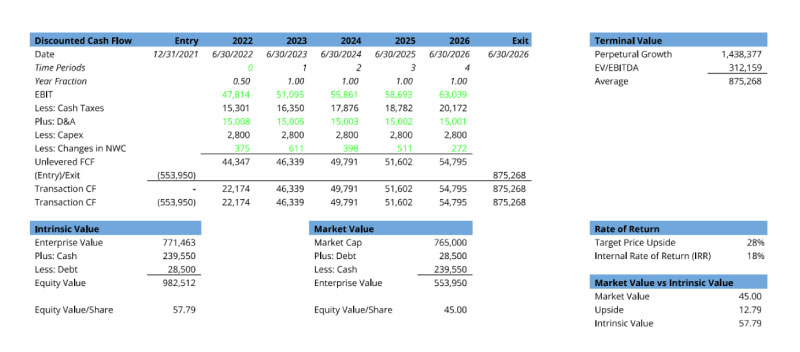
Discounted Cash Flow (DCF) Model
- The Discounted Cash Flow (DCF) model is a widely used financial model that estimates the value of an investment or business based on its future cash flows.
- It’s a valuation technique commonly employed in corporate finance and investment analysis.
- Incorporating the concept of the time value of money, the DCF model takes into account that the value of a future dollar will be less compared to its present value.
Steps to Create a DCF model:
Step 1: Project Cash Flows
Begin by forecasting the future cash flows expected to be generated by the investment or business. Typically, these cash flows are projected over a specific period, such as five or ten years. The projections should be based on realistic assumptions and consider factors such as:
- revenue growth
- operating expenses
- capital expenditures
- working capital requirements
Step 2: Determine the Discount Rate
Determine an appropriate discount rate, also known as the required rate of return or the cost of capital. The discount rate represents the rate of return expected by investors or the cost of financing the investment.
It reflects the risk associated with the investment and is often determined by considering factors such as the company’s cost of debt, cost of equity, and overall market conditions.
Step 3: Calculate the Present Value
Calculate the present value of each projected cash flow by discounting it back to the present using the discount rate. The formula for calculating the present value is:
PV = CF / (1 + r)^n
Here, PV shows the present value, CF represents the cash flow, r is the discount rate, and n is the period in which the cash flow is expected.
Step 4: Estimate the Terminal Value
Estimate the terminal value, which represents the value of the investment or business beyond the projection period. The terminal value is usually determined using a suitable valuation method, such as the perpetuity growth method or the exit multiple method.
It captures the expected future cash flows beyond the projection period and is typically calculated as a multiple of the final projected cash flow.
Step 5: Perform Discounted Cash Flow Calculation
Add the present values of the projected cash flows and the terminal value to arrive at the total discounted cash flow. This represents the estimated intrinsic value of the investment or business. The formula for calculating the discounted cash flow is:
DCF = PV1 + PV2 + … + PVn + TV
Here, DCF is the discounted cash flow, PV is the present value, and TV is the terminal value.
Step 6: Conduct Sensitivity Analysis
Perform a sensitivity analysis by varying the key assumptions, such as revenue growth rates, discount rates, or terminal value multiples. This analysis helps assess the sensitivity of the valuation to changes in these assumptions and provides insights into the potential risks and uncertainties associated with the investment.
- The DCF model provides a quantitative approach to valuing investments or businesses based on their expected future cash flows.
- It’s a powerful tool for decision-making, investment analysis, and determining the attractiveness of an opportunity.
Mergers and Acquisitions (M&A) Model
- The Mergers and Acquisitions (M&A) Model is a financial tool used to analyze and evaluate the financial implications of potential mergers, acquisitions, or other strategic transactions.
- It helps organizations assess the value of target companies, estimate the synergies and potential benefits of the transaction, and determine the financial impact on the acquiring company.
Key Components of the M&A Model
Financial Statements
The model incorporates historical and projected financial statements of both the acquirer and the target company, including the income statement, balance sheet, and cash flow statement.
Valuation
Various valuation techniques, such as discounted cash flow (DCF), comparable company analysis, or precedent transactions, are employed to estimate the value of the target company. These valuation methodologies help determine a fair price for the acquisition.
Synergy Analysis
The M&A Model assesses the potential synergies that can be achieved through the merger or acquisition. Synergies can include cost savings, revenue growth opportunities, operational efficiencies, or market expansion benefits. Quantifying and incorporating these synergies into the model helps evaluate the overall value and potential benefits of the transaction.
Financing Structure
The model considers different financing options for the transaction, including equity, debt, or a combination of both. It evaluates the impact of various financing structures on the financial position and capital structure of the acquiring company.
Projections and Sensitivity Analysis
The M&A Model incorporates projected financial data for the combined entity, taking into account the impact of the acquisition on revenue growth, costs, and cash flows. Sensitivity analysis allows for testing different scenarios and assessing the financial outcomes under varying assumptions.

Leveraged Buyout (LBO) Model
- The Leveraged Buyout (LBO) Model is a financial tool used to analyze and evaluate the financial feasibility and potential returns of a leveraged buyout transaction.
- An LBO is required when a company or a group of investors acquires another company primarily using debt financing, expecting to generate returns through improving the target company’s financial performance or through subsequent asset sales.
Key Components of the LBO Model
Target Company Analysis
The model begins with a comprehensive analysis of the target company’s historical financial statements, including:
- income statement
- balance sheet
- cash flow statement
This analysis provides insights into the company’s historical performance, growth prospects, and potential for improvement.
Acquisition Structure
The LBO Model incorporates the structure of the acquisition, including the purchase price, the amount of debt required for financing, and the equity contribution from the acquiring party. It evaluates the impact of the debt-to-equity ratio on the financial structure and risk profile of the transaction.
Financial Projections
The model projects the future financial performance of the target company post-acquisition, considering factors, such as revenue growth, cost efficiencies, and capital and operational expenditure requirements. These projections help estimate the potential returns and cash flow generation of the target company under the new ownership.
Debt Financing
The LBO Model assesses the debt financing options for the transaction, including senior debt, mezzanine debt, and subordinated debt. It considers the interest rates, repayment schedules, and covenants associated with debt financing to evaluate the impact on the cash flow and financial flexibility of the acquired company.
Returns Analysis
The LBO Model calculates various financial metrics, such as internal rate of return (IRR), return on investment (ROI), and equity multiple, to assess the potential returns and profitability of the LBO transaction. These metrics help investors evaluate the attractiveness of the investment and compare it to alternative investment opportunities.
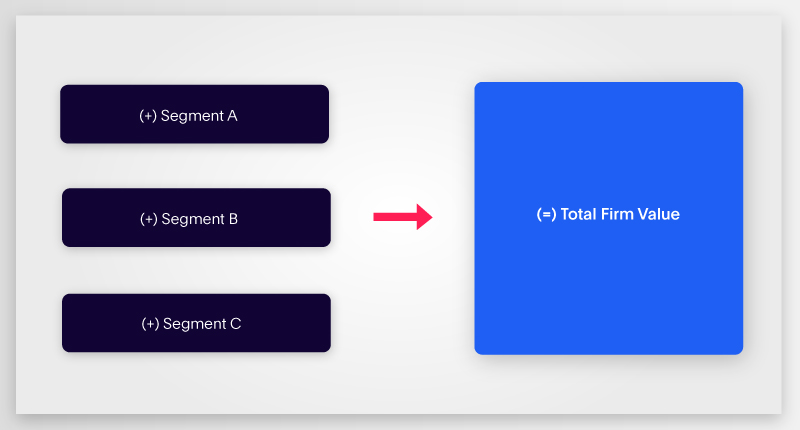
Sum-of-the-Parts Model
- The Sum-of-the-Parts Model is a financial analysis technique used to value a company by breaking it down into its individual business segments or assets and assigning a separate value to each component.
- This model is particularly useful when a company operates multiple distinct businesses or holds significant assets that have different value drivers and market dynamics.
SUM OF THE PARTS VALUATION FORMULA
Implied Equity Value = Enterprise Value (Segment A) + Enterprise Value (Segment B)… – Net Debt
Key Components of the Sum-Of-The-Parts Model:
Identifying Business Segments/Assets
The model begins by identifying and defining the various business segments or assets that make up the company. These segments/assets can be based on product lines, geographical regions, subsidiaries, or other relevant divisions.
Analysis and Valuation
Each business segment or asset is analyzed individually, taking into account its financial performance, growth prospects, competitive landscape, and market conditions. Different valuation techniques may be applied, such as discounted cash flow (DCF), comparable company analysis, or asset-based valuation methods.
Weighting and Aggregation
After valuing each business segment or asset, weights are assigned to reflect their relative importance in the overall company’s value. These weights can be based on factors such as revenue contribution, profitability, or strategic significance. The individual values are then aggregated to determine the total value of the company.
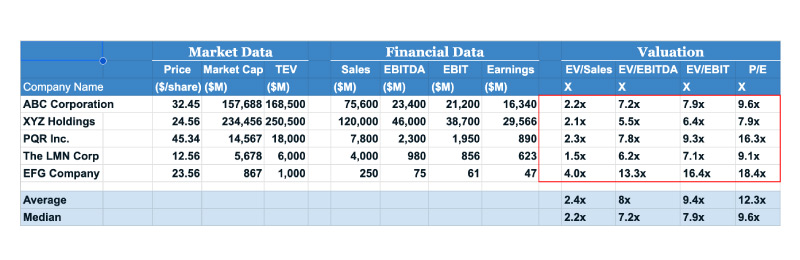
Comparable Company Analysis (CCA)
- Comparable Company Analysis, also known as “trading multiples” or “peer group analysis,” is a valuation method used to determine the value of a company by comparing it to similar publicly traded companies in the same industry.
- CCA helps investors, analysts, and financial professionals assess the relative value of a company by analyzing its financial metrics and performance in relation to its peers.
Key Components of CCA:
Selecting Comparable Companies
Identify a set of comparable companies that are similar to the target company in terms of industry, size, business model, growth prospects, and market dynamics. This group of peers should be publicly traded and represent a reasonable sample of the market.
Financial Ratio Analysis
Analyze key financial ratios and multiples of the comparable companies, such as price-to-earnings ratio (P/E), price-to-sales ratio (P/S), price-to-book ratio (P/B), and enterprise value-to-EBITDA ratio (EV/EBITDA). These ratios help assess the relative valuation levels of the peer group.
Establishing Valuation Multiples
Determine the appropriate valuation multiples to be applied to the target company based on the analysis of the comparable companies. This involves calculating the average or median multiples of the peer group and considering factors such as growth rates, profitability, and risk profiles.
Applying Multiples to the Target Company
Apply the valuation multiples derived from the peer group analysis to the corresponding financial metrics of the target company. This allows for the estimation of the target company’s value based on the benchmarked multiples.
How to Build a Financial Model
Building a financial model is a crucial skill for financial professionals, analysts, and anyone involved in financial analysis and forecasting. Spreadsheets like Microsoft Excel provide a powerful platform to create dynamic and customizable models that can assist in decision-making, planning, and financial analysis.
Steps to build a financial model in Excel:
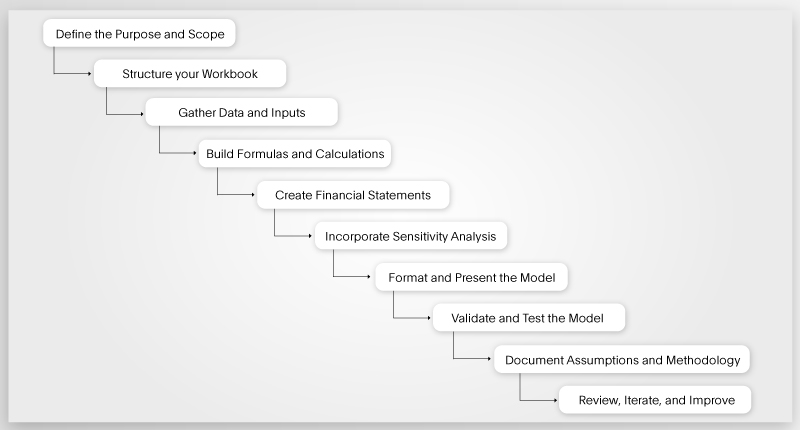
Step 1: Define the Purpose and Scope
- Clearly define the objective of your financial model, such as forecasting revenues, analyzing investment opportunities, or evaluating business performance.
- Determine the specific time frame, level of detail, and key variables to include in your model.
Step 2: Structure your Workbook
- Create a new workbook in Excel and organize it into different worksheets or tabs.
- Common worksheets may include Inputs/Assumptions, Income Statement, Balance Sheet, Cash Flow Statement, and Analysis/Outputs.
Step 3: Gather Data and Inputs
- Collect historical financial data, industry benchmarks, and any relevant inputs or assumptions required for your model.
- Enter the data and assumptions in the appropriate cells of your Inputs/Assumptions worksheet.
Step 4: Build Formulas and Calculations
- Use Excel’s formulas and functions to perform calculations based on the inputs and assumptions.
- Start with basic calculations such as sums, averages, and percentages.
- Gradually build more complex formulas for calculations such as growth rates, ratios, and projections.
Step 5: Create Financial Statements
- Use the calculations from the previous step to generate the Income Statement, Balance Sheet, and Cash Flow Statement.
- Link the appropriate cells and formulas to ensure the financial statements are dynamic and update automatically when inputs or assumptions change.
Step 6: Incorporate Sensitivity Analysis
- Utilize Excel’s data tables, scenarios, or goal seek functions to perform sensitivity analysis.
- Identify key variables in your model and analyze how changes in those variables impact the financial outputs.
- Create scenarios by modifying specific inputs, and assess the resulting impact on the financial statements.
Step 7: Format and Present the Model
- Apply formatting techniques to make your model visually appealing and user-friendly.
- Use consistent fonts, colors, and borders throughout the workbook.
- Add headings, subheadings, and labels to clearly identify different sections and variables.
- Utilize charts, graphs, and conditional formatting to visualize the data and make it easier to interpret.
Step 8: Validate and Test the Model
- Thoroughly validate your financial model to ensure its accuracy and reliability.
- Cross-check formulas and calculations for accuracy.
- Review the outputs against known data or benchmarks to verify the model’s performance.
- Conduct sensitivity tests to assess the model’s response to changes in key variables.
Step 9: Document Assumptions and Methodology
- Document the key assumptions, data sources, and methodologies used in your financial model.
- Include any specific instructions or caveats that users should be aware of.
- Review the outputs against known data or benchmarks to verify the model’s performance.
- This documentation will provide transparency and facilitate understanding and replication of the model.
Step 10: Review, Iterate, and Improve
- Continuously review and iterate on your financial model to enhance its accuracy and functionality.
- Seek feedback from colleagues, experts, or users to identify areas for improvement.
- Incorporate feedback and refine your model over time to make it more robust and effective.
Note: The above section provides a general overview of the process of Financial Model Building. To ensure accuracy and completeness in implementing a financial model, it’s recommended to refer to specialized resources and financial textbooks or seek assistance from financial professionals experienced in using these models.
Financial Modeling Best Practices for Enterprises
Financial modeling is a crucial tool for enterprises to analyze and evaluate financial data. Here are some key best practices for enterprises when it comes to financial modeling:
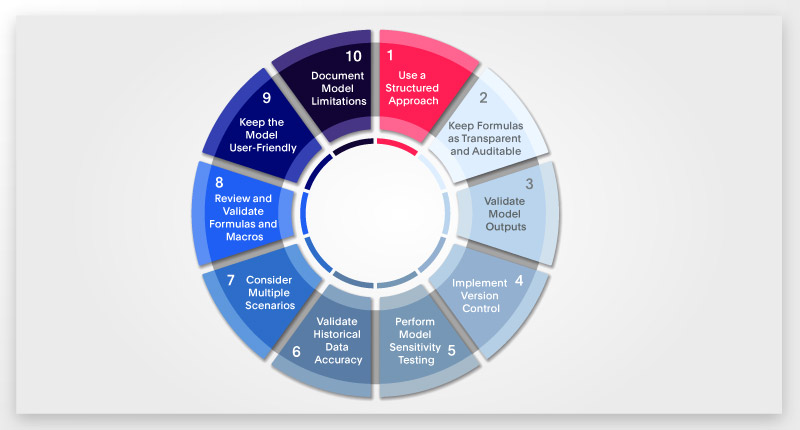
Use a Structured Approach
Follow a structured framework or methodology when building financial models. This helps organize the model’s components, maintain consistency, and ensure that all relevant aspects are considered.
Keep Formulas Transparent and Auditable
Ensure that formulas and calculations in the financial model are transparent and easy to understand. Use clear labels, cell references, and formula annotations to make the model auditable and facilitate error identification and troubleshooting.
Validate Model Outputs
Validate the outputs of the financial model against external benchmarks, industry standards, or expert opinions. This provides an additional layer of validation and improves confidence in the model’s accuracy.
Implement Version Control
Maintain version control for the financial model to track changes, revisions, and updates. Assign version numbers or use version control software to keep track of different iterations of the model. This helps in managing changes and allows for easy reference to previous versions if needed.
Perform Model Sensitivity Testing
Conduct sensitivity testing by varying key inputs or assumptions to gauge the model’s response to different scenarios. This helps in understanding the model’s sensitivity to changes in variables and assists in risk assessment and decision-making.
Validate Historical Data Accuracy
Verify the accuracy of historical data used in the financial model. Cross-reference the data with reliable sources or financial statements to ensure its integrity. Inaccurate historical data can lead to flawed projections and unreliable outcomes.
Consider Multiple Scenarios
Incorporate multiple scenarios in the financial model to assess various potential outcomes. This could include optimistic, pessimistic, and base-case scenarios. By considering different scenarios, decision-makers gain a more comprehensive understanding of the range of potential outcomes.
Review and Validate Formulas and Macros
Regularly review and validate complex formulas and macros in the financial model. Check for errors, inconsistencies, or outdated functions. Use error-handling techniques to minimize the risk of formula errors.
Keep the Model User-Friendly
Design the financial model with user-friendliness in mind. Organize inputs, outputs, and assumptions in a logical manner. Use clear instructions, dropdown menus, or data validation to simplify data entry. A user-friendly model improves usability and reduces the likelihood of errors.
Document Model Limitations
Clearly document any limitations or constraints of the financial model. Identify and communicate any areas where the model’s accuracy may be compromised or where additional data or expert judgment is required. This helps users understand the boundaries of the model and make informed decisions.
By following these best practices, enterprises can enhance the quality, reliability, and usability of their financial models.
Financial Modeling Tools
Financial modeling tools are software applications specifically designed to assist in creating, analyzing, and interpreting financial models. Here are some popular financial modeling tools commonly used by professionals:
Microsoft Excel
Microsoft Excel is the most widely used and versatile tool for financial modeling. Excel provides a wide range of built-in functions, data analysis tools, and charting options, making it an essential tool for financial professionals.
Google Sheets
Google Sheets is a web-based spreadsheet tool that offers similar features to Microsoft Excel.
Tableau
Tableau is a data visualization tool that helps present financial data in an interactive and visual format.
Power BI
Power BI is a business intelligence tool that enables users to create interactive dashboards and reports from multiple data sources.
Bloomberg Terminal
Bloomberg Terminal is a comprehensive platform used by finance professionals for accessing real-time financial data, news, and analytics.
FactSet
FactSet is a financial data and analytics platform that provides access to extensive financial datasets, research reports, and modeling tools.
MATLAB
MATLAB is a programming language and computing environment widely used in quantitative finance and financial modeling.
Python
Python is a versatile programming language commonly used in financial modeling due to its extensive libraries and frameworks for data analysis, modeling, and machine learning.
Conclusion
Financial modeling is both an art and a science, requiring a combination of technical skills, analytical thinking, and business acumen. Through this guide, we have explored different types of financial models. Each model serves a specific purpose and provides valuable insights into different aspects of financial analysis.
We have also discussed the importance of following best practices in financial modeling, such as maintaining accuracy, simplicity, and transparency, as well as incorporating sensitivity analysis and scenario planning. In conclusion, by mastering the art of financial modeling, you’ll be equipped with a powerful toolkit to analyze complex financial data, make strategic decisions, and contribute to the success of your organization.
Frequently Asked Questions (FAQs)
1. What are the six types of financial models?
The six types of financial models commonly used are:
- 1. Three Statement Model
- 2. Discounted Cash Flow (DCF) Model
- 3. Mergers and Acquisitions (M&A) Model
- 4. Leveraged Buyout (LBO) Model
- 5. Sum-of-the-Parts Model
- 6. Comparable Company Analysis (CCA)
2. What is financial modeling used for?
Financial modeling is used to analyze and interpret financial data, assess investment opportunities, make informed business decisions, perform valuation of assets or companies, create financial forecasts and projections, support strategic planning, manage risks, evaluate capital budgeting, aid in budgeting and financial planning, and communicate financial information effectively to stakeholders.
3. What are financial modeling skills?
Financial modeling skills refer to the ability to construct and analyze financial models effectively. These skills include proficiency in spreadsheet software, understanding financial statements, knowledge of financial concepts and techniques, ability to perform complex financial calculations, data analysis, forecasting, risk assessment, and the capability to accurately interpret and communicate model results.
ABOUT THE AUTHOR
Sushmita Prem
Sushmita is a Marketing Specialist at Deltek | Replicon, specializing in B2B cloud applications. As a seasoned IT engineer, she brings a unique perspective to her role, having firsthand experience in creating and shaping the very solutions she now markets. She produces content that explores the convergence of business and technology, and provides readers with valuable insights into the practical applications of this intersection.