Using Tableau to analyze your Replicon data
Three types of connectors are available for accessing your Replicon data using Tableau, where you can view and build charts based on that data:
- Demo dashboards use sample Replicon data to show you what you can do with your data in Tableau
- Template dashboards use your organization’s data as the source and starting point for sample charts
- Replicon’s Web Data Connector for Tableau allows you to create charts from scratch. Try this option if you don’t need the example charts from the sample dashboards.
Refer to Gaining business intelligence using your Replicon data for more information on these connection options, and about other methods of analyzing your data.
All of these options are supported for use with the desktop version of Tableau. They should also work with other editions of Tableau, though their use with other editions hasn’t yet been tested.
When you use a connector, users only see data they have permission to view in the rest of the Replicon application.
Refer to https://www.tableau.com/learn for more information on using Tableau.
Viewing demo dashboards
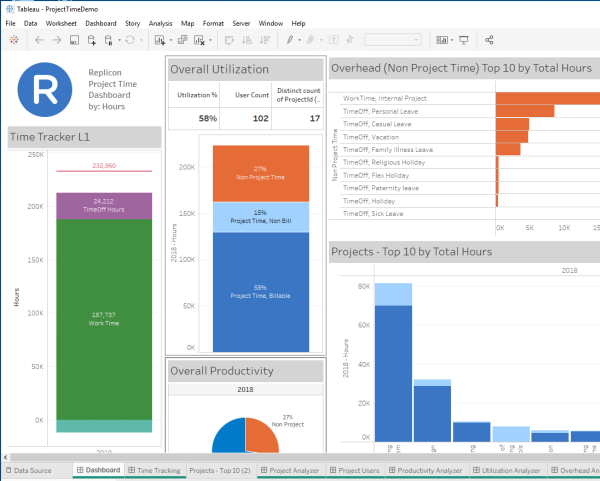
To help you get started with analyzing your data, we’ve set up a demo dashboard in Tableau you can use. It can give you an idea of what you can do with Replicon data using Tableau.
Currently, we offer a dashboard for project analytics, called the ProjectTime dashboard. It shows sample time tracking, utilization, productivity, project, and time off charts, and can be used with any Replicon instance with project functionality.
Each sample dashboard is designed for certain products and product combinations. If you aren’t licensed for the products a dashboard is designed for, you may see errors.
To view a demo dashboard:
- Click the link below to download the demo zip file:
- Extract the file contents.
- Double-click the .twbx
Tableau will launch, with the demo workbook open.
Viewing your Replicon data in template dashboards
Use template dashboards to see sample charts from the demo dashboard populated with your organization’s Replicon data. You can use these charts as they are, or use them as a starting point for your own custom graphs.
To view your Replicon data in sample charts:
- Download the sample data zip file:
- Unzip the file, and launch the .twb template file.
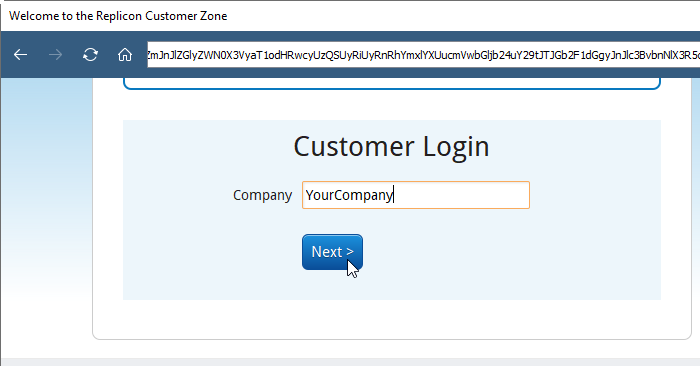
A dialog will open, displaying authentication fields for your Replicon account.
- Enter the company name you use to log in to your Replicon instance, and click Next.
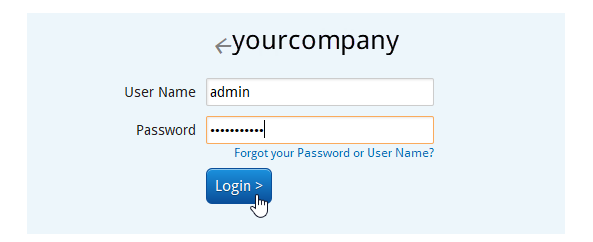
- Enter your user name and password, and click Login.
After a moment, a Processing Request dialog displays.
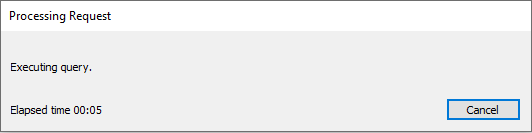
You will have to wait a moment, or longer, depending on the size of your database, as the connector loads your data.
You may see this message when you authenticate:
Dashboard Unavailable: There was a problem connecting to the “Time Entry” data source.
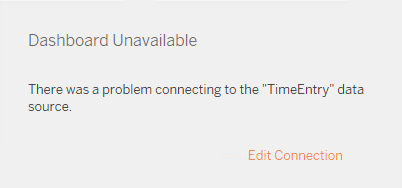
You can ignore this message. It displays before you are prompted to authenticate; Once you’ve authenticated, this message is no longer valid.
- You will be prompted to authenticate again. And, once again, you’ll need to wait for data to load.
You need to authenticate twice because your data is divided into two data sets, TimeEntry and TimeAllocation, and you must grant access to each.
When your Replicon data has loaded, the demo charts will display, using your data.
- To save a copy of your data charts, click File > Save As and save the workbook.
When you open this copy or the original template file, the charts will use the data available when you last saved the file.
If you’ve made changes to data in Replicon that you’d like reflected in the charts, you can refresh the data in Tableau. You’ll be prompted to authenticate.
The charts look strange when using my company’s data
The sample data charts are optimized for the demo dashboards. Therefore, when you switch to using your own data, some of the charts may not look quite right. Common causes for this include:
- Your filter date range doesn’t include any data
The sample data is filtered for 2018 by default; you may have to adjust the date range to see meaningful visuals if you don’t have much 2018 data.
- You don’t have data for a parameter used in the graph
For example, some customers don’t track costs, only hours. In that case, charts filtered by cost won’t look right. To fix this issue, you can switch to filter data by hours.
How do I see updated data, if I make a change in Replicon?
If you want to see changes you’ve made to your data reflected in the charts:
- Click Data > Refresh All Extracts.
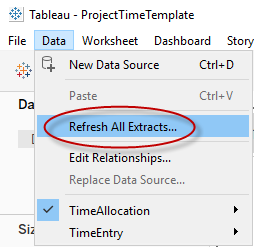
- Click Refresh, then wait while the data refreshes.
I see an error instead of a chart
If you see an error in place of a chart (for example, Error: Unknown table ‘CostItem’), this means you don’t have access to the data needed to populate that chart.
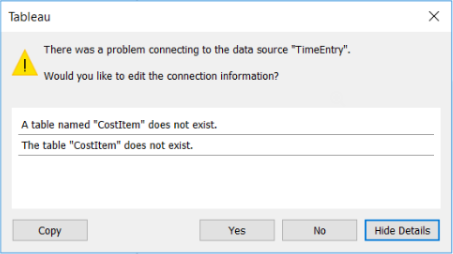
For instance, you may not have the necessary products assigned, or you may not have permission to view that data.
Connecting using Replicon’s Web Data Connector
Using Tableau’s Web Data Connector, you’ll access your Replicon data directly via our Replicon API for BI Services. This connection is certified by Tableau, and is available from within their interface.
Once connected, you’ll be able to access most Replicon data tables, and create visual representations of that data from scratch using Tableau.
To connect to your data:
- Launch Tableau.
- From the Connect side menu, under To a Server, click Web Data Connector.
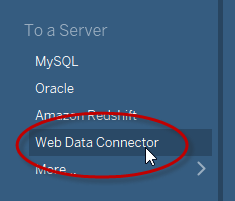
A Web Data Connector dialog displays.
- Enter tableau.replicon.com in either of the fields that display – the text will appear in the field at the top of the dialog in either case. Click Enter.
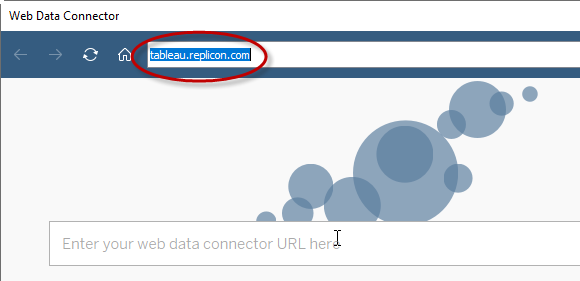
A dialog showing Replicon’s login fields displays.
- Enter the company name you use to log in to your Replicon instance, and click Next.
- Enter your user name and password, and click Login.
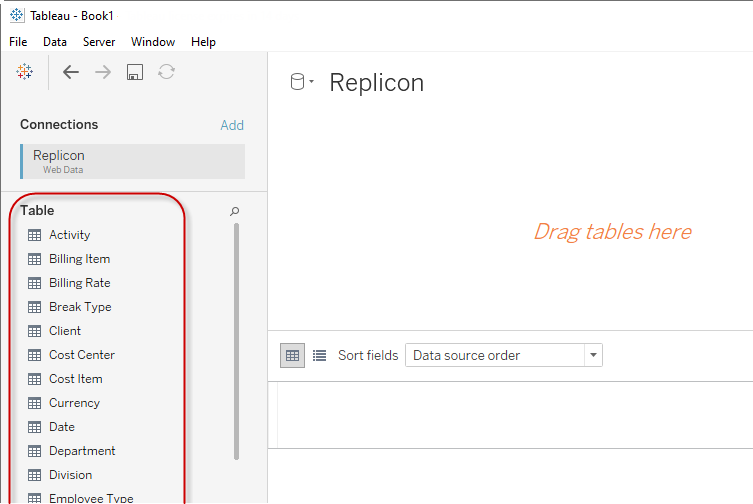
You may have to wait a moment as the connector loads your data.
A Tableau workbook will open, with the available Replicon data tables displayed on the left-hand side of the page.
FAQs
How can I share a Tableau workbook with my team?
There are a couple of ways to share dashboards:
- Have each team member establish their own connection to the workbook using Tableau.
In this case, the user will log in using their personal Replicon credentials, and will only be able to view data they have permission to view in Replicon. - Publish workbooks to your Tableau Server, where team members can access them.
In this case, team members' data access won’t be restricted by their Replicon permissions. Each team member will have access to all data the account holder who authenticated with Replicon has access to.
Related links
Gaining business intelligence using your Replicon data
Purchasing and configuring Replicon for ADP
Introduction to the Replicon API
Using dashboards
Using dashboards (video)