Using Microsoft Power BI to analyze your Replicon data
Three types of connectors are available for connecting to your Replicon data using Microsoft Power BI, where you can view and build charts based on that data.
- Sample dashboards use sample Replicon data to show you what Microsoft Power BI can do
- Template dashboards use your organization’s data as the source and starting point for sample charts
- Replicon’s connector for Microsoft Power BI allows you to create charts from scratch. Try this option if you don’t need the examples from the sample dashboards.
Refer to Gaining business intelligence using your Replicon data for more information on these connection options, and about other methods of analyzing your data.
All of these options are supported for use with the desktop version of Power BI. They should also work with other editions of Power BI, though their use with other editions hasn’t yet been tested.
When you use a connector, users only see data that they have permission to view in the rest of the Replicon application.
Refer to https://powerbi.microsoft.com/en-us/learning for details on using Power BI.
Viewing demo dashboards
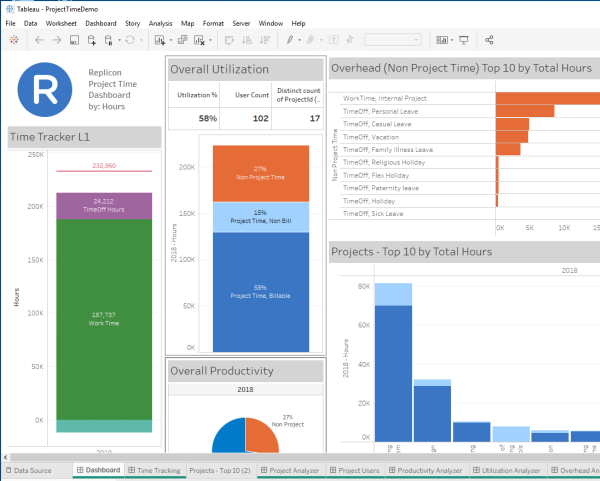
To help you get started with analyzing your data, we’ve set up a demo dashboard in Microsoft Power BI you can use. It can give you an idea of what you can do with Replicon data using Power BI.
Currently, we offer a dashboard for project analytics, called the ProjectTime dashboard. It shows sample time tracking, utilization, productivity, project, and time off charts, and can be used with any Replicon instance with project functionality.
Each sample dashboard is designed for certain products and product combinations. If you aren’t licensed for the products a dashboard is designed for, you may see errors.
To view a demo dashboard:
- Launch Power BI.
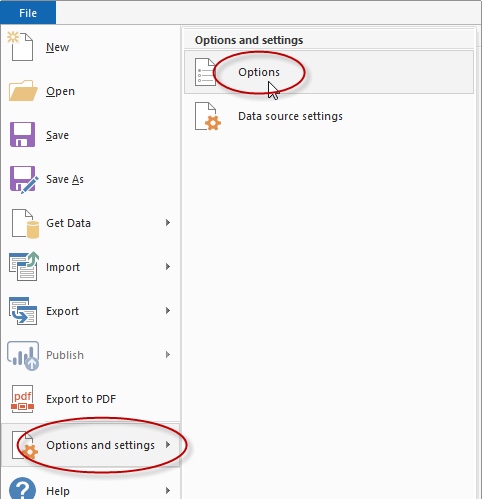
- Go to File > Options and Settings > Options.
- Then select Security, and in the Data Extensions section enable the (Not Recommended) Allow any extension to load without validation or warning option, and click OK.
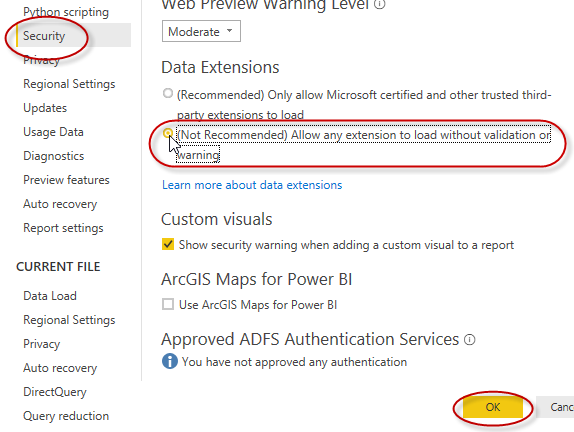
This lower security setting is required to open dashboard files, since they are not certified connections. You can switch this setting back later, if desired.
- Close Power BI.
- Click the link below to download the sample dashboard zip file:
- Double-click the downloaded file.
Power BI will re-launch, with the dashboard workbook open, displaying a tab for each type of visualization.
Viewing your Replicon data in template dashboards
Use template dashboards to see the sample charts from the demo dashboards populated with your organization’s Replicon data. You can use these charts as they are, or use them as a starting point for your own custom graphs.
To use your Replicon data in the charts:
A. Download connector file and save it to the designated location
- Create this directory on your machine:
%USERPROFILE%DocumentsPower BI DesktopCustom Connectors
- Download the Replicon connector file and copy it to the directory you just created.
- If Power BI is open, close it.
B. Download and launch the sample data file
- Download the sample data zip file:
- Unzip the file, and launch the .pbit template file.
C. Authenticate to gain access to your Replicon data
- Click Sign in.

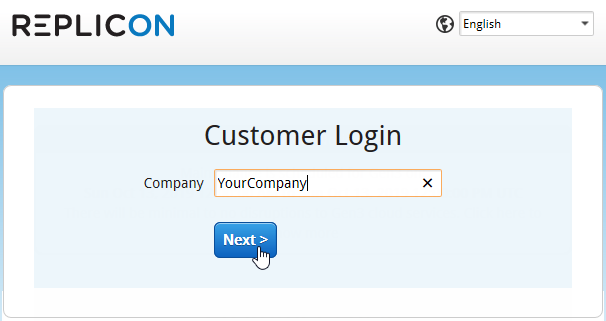
- Enter the company name you use to log in to your Replicon instance, and click Next.
![]()
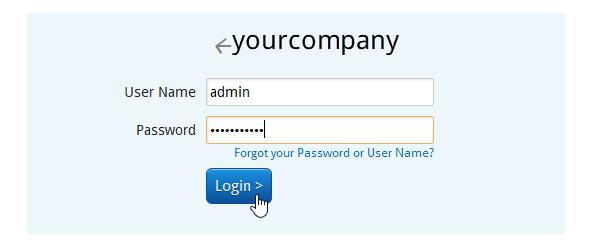
- Enter your user name and password, and click Login.
- You’ll see a message stating you’re signed in. Click Connect.
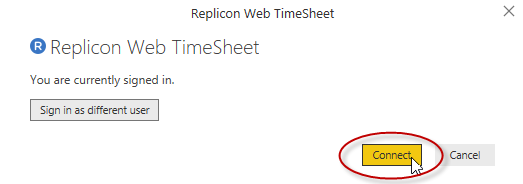
The data will now refresh. This could take a while, depending on the size of your database.
Once the refresh is complete, you’ll see your Replicon data populating the analytics charts.
D. Refresh and save dashboards
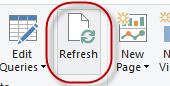
- If you want to see changes you’ve made to your data in Replicon reflected in the charts, click Refresh.
- Click File > Save As, and choose a name and location for a .pbix version of the workbook.
This version will retain the Replicon credentials used in the template file, so you can refresh and view updates with it.
Reusing the template file
If you use the template file more than once, you’ll remain authenticated on subsequent uses. If you want to authenticate using different credentials, you’ll need to download the file again, or delete the Replicon source in the template file you’ve used.
To delete the Replicon source:
- Go to File > Options and settings > Data source settings.
- In the dialog that displays, click Clear Permissions, then click Delete, then Close.
The charts look strange when using my company’s data
The sample data charts are optimized for the sample data source. Therefore, when you switch to using your own data, some of the charts may not look quite right. Common causes for this include:
- Your filter date range doesn’t include any data
The sample data is filtered for 2018 by default; you may have to adjust the date range to see meaningful visuals if you don’t have much 2018 data.
- You don’t have data for a parameter used in the graph
For example, some customers don’t track costs, only hours. In this case, charts filtered by cost won’t look right. To fix this issue, you can switch to filter data by hours.
I see an error instead of a chart
If you see an error in place of a chart (for example, Error: Unknown table ‘CostItem’), this means you don’t have access to the data needed to populate that chart.
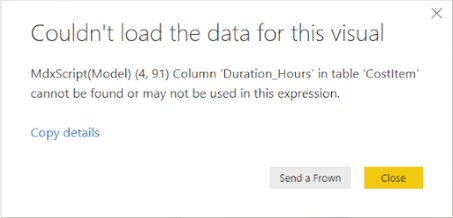
For instance, you may not have the necessary products assigned, or you may not have permission to view that data.
Connecting using Replicon’s connector for Microsoft Power BI
When you use our native connector to connect to Microsoft Power BI, your data source is our Replicon API for BI Services.
Once connected, you’ll be able to access most Replicon data tables, and create visual representations of that data from scratch using Power BI.
To connect:
A. Set Power BI security settings to allow connection
- Launch Power BI.
- Go to File > Options and Settings > Options.

Then select Security, and in the Data Extensions section enable the (Not Recommended) Allow any extension to load without validation or warning option, and click OK.

This lower security setting is required to open dashboard files, since they are not certified connections. You can switch this setting back later, if desired.
- Close Power BI.
B. Download connector file and save it to the designated location
- Create this directory on your machine:
%USERPROFILE%DocumentsPower BI DesktopCustom Connectors
- Download the Replicon connector file and copy it to the directory you just created.
C. Launch the connector
- Re-launch Power BI.
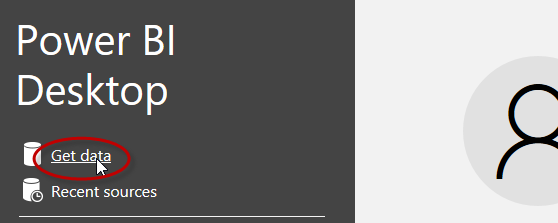
- Click Get Data.
- Enter Replicon in the search field.
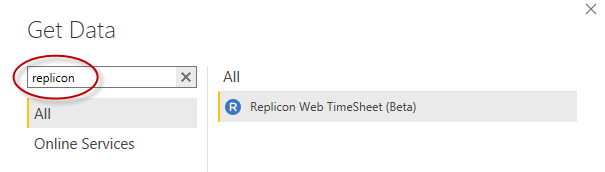
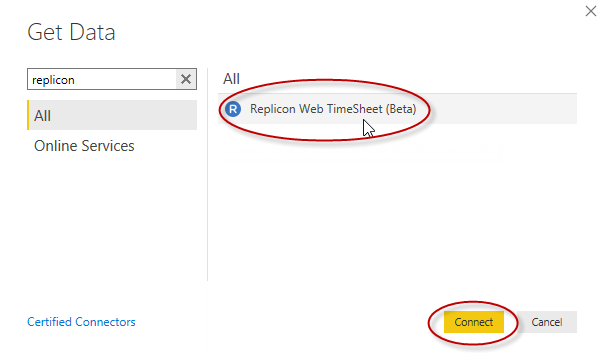
The file name should display in the search results on the right-hand side of the dialog.
- Select the file name, and click Connect.
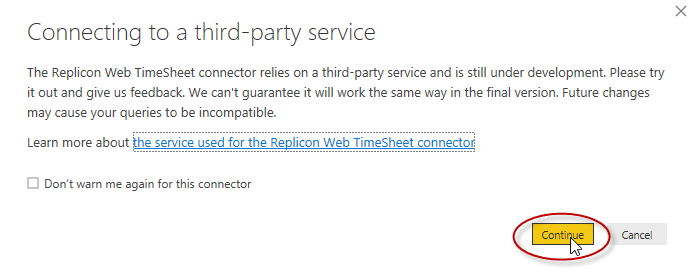
You’ll see a message indicating this is a beta connector.
- Click Continue.
D. Authenticate to gain access to your Replicon data.
- Click Sign in.
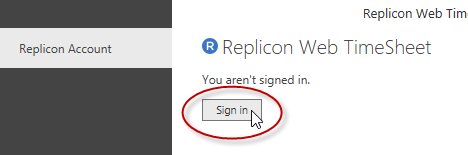
- Enter the company name you use to log in to your Replicon instance, and click Next.
- Enter your user name and password, and click Login.
- Click Allow in the dialog that displays.
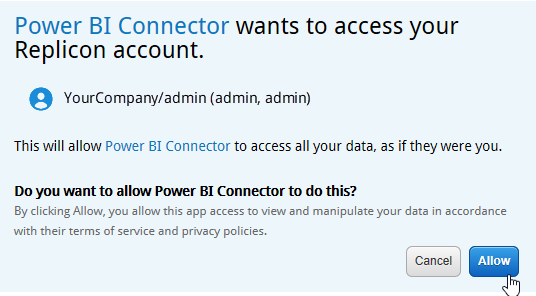
- You’ll see a message stating you’re signed in. Click Connect.

A Navigator page displays. The names of the data sets available to you display in the left column.
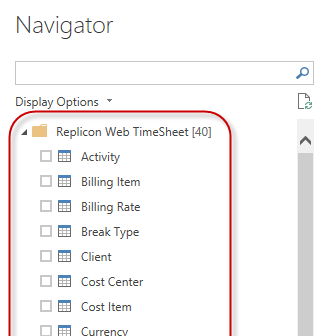
E. Import your Replicon data into Power BI
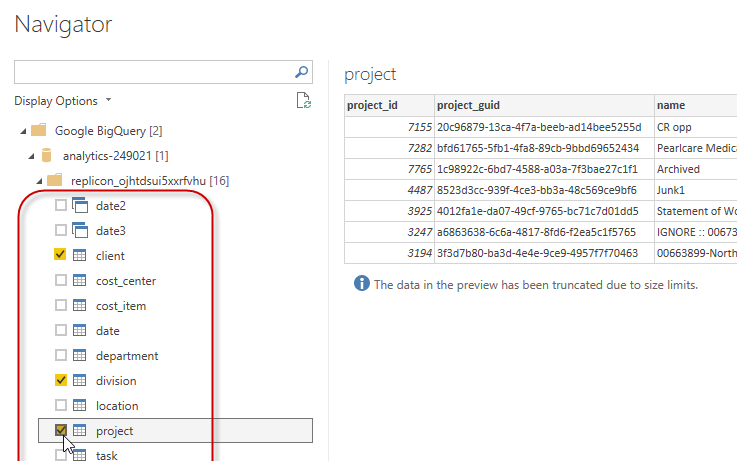
- Double-click a data set to view the available data tables. Enable the check boxes beside each table you want to work with. Then click Load.
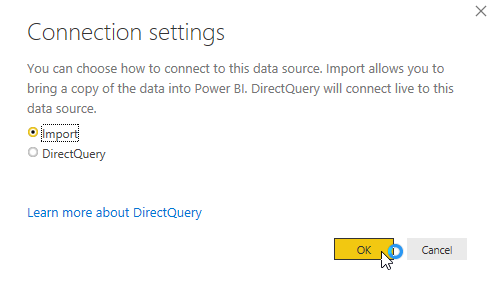
- A Connection Settings dialog displays, asking you to choose how to access the tables you selected.
We recommend choosing the Import option, which will move all data at once, rather than by queries. This option is sufficient for most customers.
Your Replicon data will be imported into Power BI.
FAQs
How can I share a Power BI workbook with my team?
There are a couple of ways to share dashboards:
- Have each team member establish their own connection to the workbook using Microsoft Power BI.
In this case, the user will log in using their personal Replicon credentials, and will only be able to view data they have permission to view in Replicon.
- Publish the workbook to the cloud version of Power BI (Microsoft Power BI Services), share it with your group, and then each team member can access the workbook using their Power BI Pro account. Additional licensing may be required.
In this case, team members' data access won’t be restricted by their Replicon permissions. Each team member will have access to all data the account holder who authenticated with Replicon has access to.
Related links
Gaining business intelligence using your Replicon data
Using Tableau to analyze your Replicon data
Introduction to the Replicon API
Using dashboards
Using dashboards (video)