Grouping and summarizing report data
You can group report data by columns or rows you select, to help you better understand the data. You can also set reports to automatically display the sum, average, maximum, minimum, or count of data in a column.
Grouping report data by row or column
You can group report data by select columns that display in each report. Columns can be grouped by row or by column.
Example of grouping by row
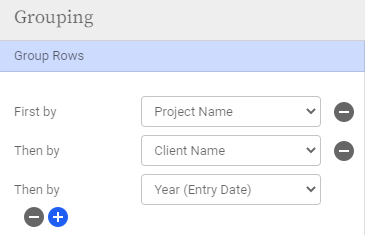
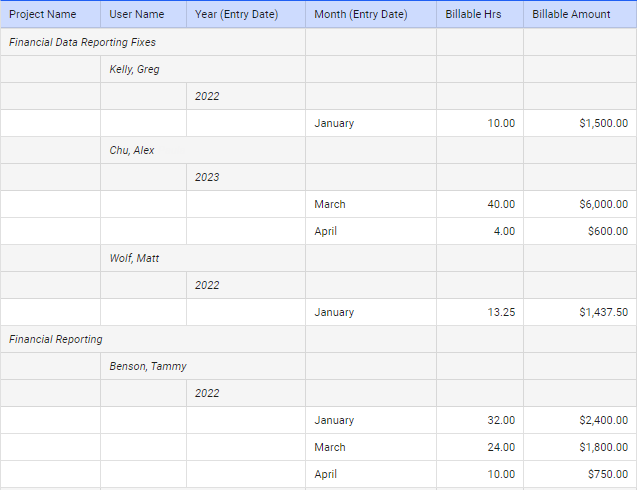
In the Billing report, if you group data by Project Name, then by User Name, and then by Year (Entry Date):
The report would look like this:
Setting up data grouping
To group report data:
- Go to Reports, and open the report whose data you want to group.
- Click the Settings button.
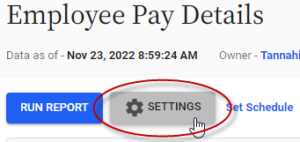
The Reports Settings dialog displays.
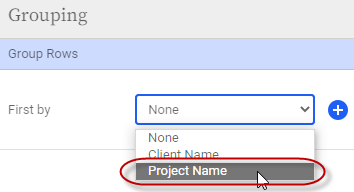
- In the Grouping section at the bottom of the dialog, select a field to group by from either the Group Rows or Group Columns section, as applicable.
- If you want to group by more than one field, click the
 icon and select an additional field.
 - Click Done.
Columns you group by will display first in the report, regardless of where they display in the Report Settings dialog.
Summarizing report data in a column
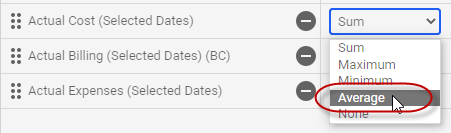
For any summable fields in a report, you can set the report to automatically calculate an average or sum for all values in that column, or display the minimum or maximum value listed in that column.
A count option is also available for certain fields, like User Name. The count total will show the number of unique entries that display in that column (for example, the number of unique user names).
Setting up data summaries
To set up automatic summary of a column's data:
- Go to Reports, and open the report for the column you want to summarize.
- Click the Settings button.
The Reports Settings dialog displays.
For each report column that has summary options available, a drop-down displays in the Summary Options column.
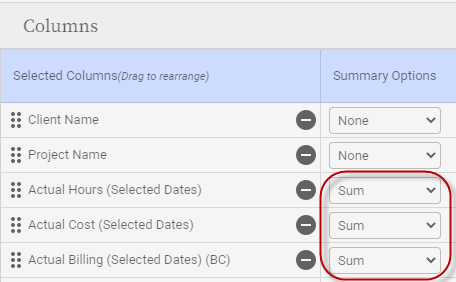
- Click a drop-down for a column, and select a summary option.
- Click Done.
Viewing summarized data in reports
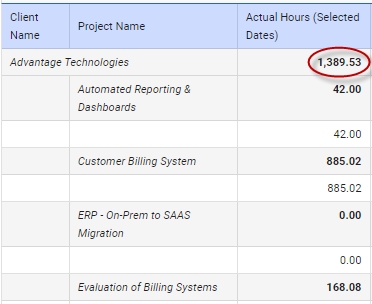
Summarized data (for example, the sum or average) displays in a dark gray row at the bottom of the report. The sum or average for any data groupings you’ve set up will also display.
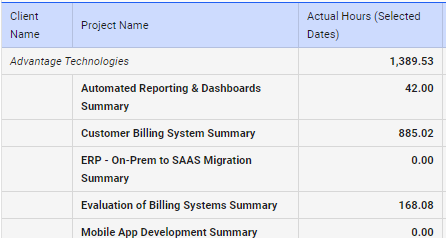
For example, in the following report, the Time Off Taken (Days) field is set to sum, so the sum of all days taken for all users shows in the bottom row of the report table. Plus, this report is grouped by User Name, so the total days taken for each user displays in each gray user row.
Expanding and collapsing report data
If summary options have been set up in a report, an Expand/Collapse toggle will be available under the report’s filter fields.
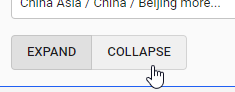
If you click Collapse, the report will collapse so only the summary rows or columns display.
In the expanded state, all data displays.
What does the Formula summary option mean?
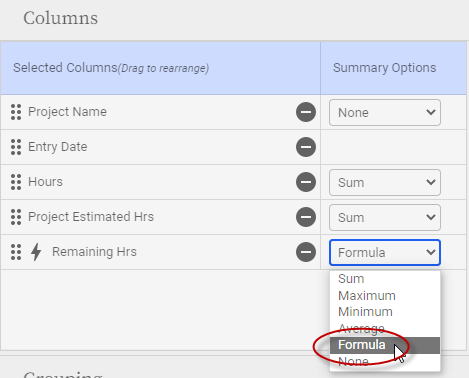
The Formula summary option can be used with report custom columns. This option calculates the summary for each variable in your custom formula, based on the summary option selected for that variable. So, it will sum each column, then apply the formula, rather than applying the formula to each row, and then generating a sum for the custom column.
This is useful if one of the variables in certain cases when applying the formula to each row first would result in an incorrect summary value.
For example, imagine you want the total remaining hours for your project. You’ve created this custom column:
Remaining Hrs = Project Estimated Hrs - Total Hrs
But, in your report, you need to show hours entered against the project each day.
In this case, calculating Project Estimated Hrs - Total Hrs for each day independently, then summing the total doesn’t make sense, since the estimate applies to the project as a whole, not to each day; 44 is not the total remaining hours for the project.
However, you can instead apply the Sum option to each variable in the formula -- Project Estimated Hrs and Total Hrs – then apply the Formula option to Remaining Hrs.
This will correctly calculate the remaining hours for the total project.
FAQs
Can we group or summarize by custom report fields?
Yes, you can group or summarize by custom fields.
Related topics
How report fields work
Using Replicon reports (video)
Using Replicon reports
Scheduling a report to be emailed regularly
Reports Field Matrix