Monitoring project progress
Project managers need to know when their projects are at risk of being late or going over budget.
Monitoring whether your project is on track
Using the Budget card
Use the Budget card available on the Summary tab for each project to view the estimates vs actuals for the project, for the the sum of its tasks, and for its actual allocated resources, in a bar graph format.
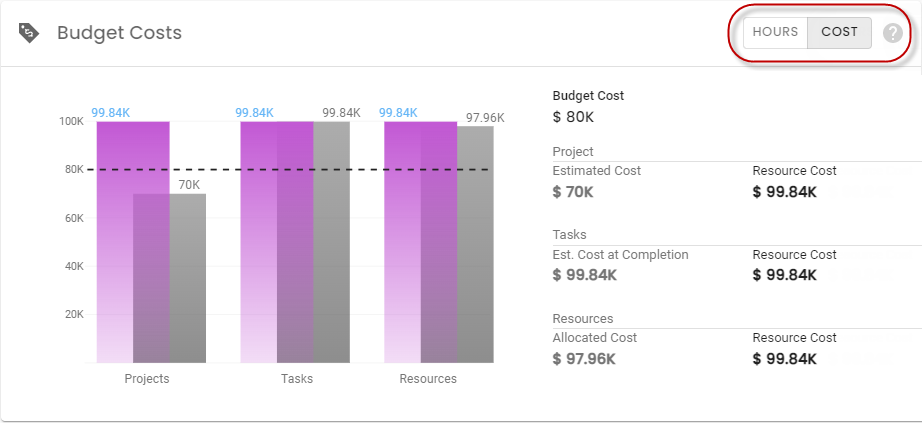
You can click the toggle in the top, right-hand corner of the card to switch between a chart based on hours and one based on cost.
Using the Project Progress dashboard
You can keep tabs on your projects using the Project Progress dashboard available on each project's landing page.
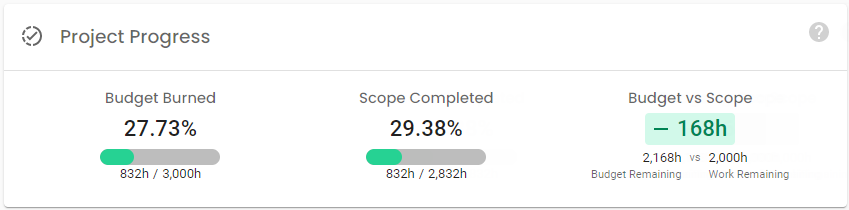
This dashboard shows the following:
|
Budget Burned = Actual Hours / Project Budget |
Shows the actual hours worked to date as a percentage of the total hours budget you entered for the project. |
|
Scope Completed = Actual Hours / Estimated at Task Completion |
Shows actual work completed as a percentage of your current full project estimate. This project estimate differs from your budget, since it's calculated based on remaining hours entered in SmartBeats (Actual Hours + Work Remaining), to ensure estimates are up to date. |
|
Budget vs Scope = Budget Remaining - Work Remaining |
Shows the variance between your current remaining hours budget and the up to date estimate of work remaining. Therefore, this metric shows whether you're on track, or not. |
All of the actuals and estimates used to generate the dashboard numbers are derived directly from the project's Gantt chart, available on the Tasks tab.
Understanding project Gantt charts
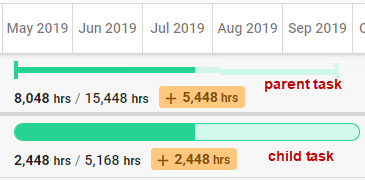
Each task progress bar in the Gantt chart shows you how much work has actually been completed versus the estimate for that task. Estimates for each child task 'roll up' to yield parent task totals.
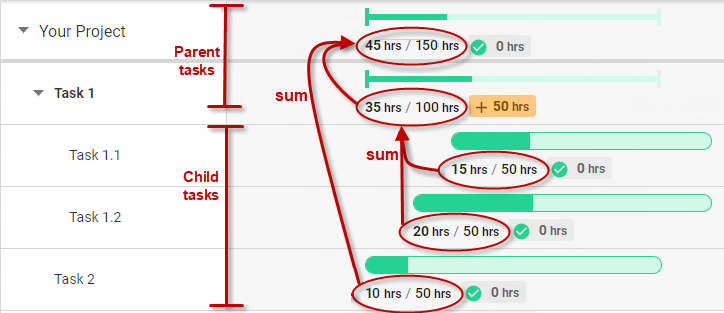
Parent tasks are tasks at any level that have child tasks, and are represented by a thin bar; Child tasks are those located at the lowest nodes of the task hierarchy, and are shown using a rounded bar.
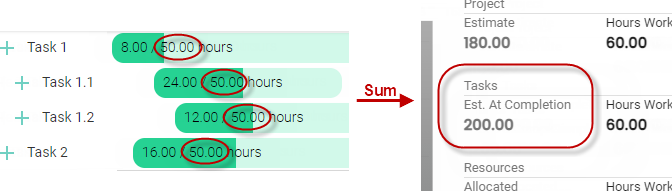
Note that only estimates entered for child tasks count toward parent-task totals; So, if you assign an estimate of 50 hours to each of four tasks in a project:
- Task 1 (parent) - 50 hours
- Task 1.1 (child) - 50 hours
- Task 1.2 (child) - 50 hours
- Task 2 (child) - 50 hours
the total project estimate will be 150 hours, since the parent-level estimate (Task 1) isn't included in the total.
Viewing task summaries
You can see a summary of estimates and actuals for each task by hovering your mouse over a bar.
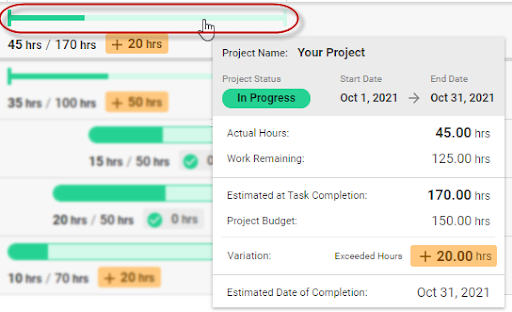
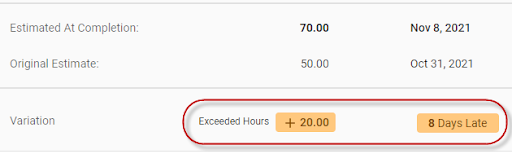
You can access more details, including the hours and date variance at completion, by clicking each task chart to open a side drawer.
FAQs
Why is the estimate different from the values I entered for the a task?
Estimates are based on the latest estimate for the task recorded via SmartBeats or, if no new estimates have been recorded, the estimate value you entered for a task. So, estimates will typically differ from the original estimates as the task progresses.
Why are there more actual hours than I expect for a parent task?
All actual hours worked are counted, even if they're recorded against a parent task. In general, we recommend not recording time against parent tasks, that is, only recording hours against tasks at the lowest branch in your hierarchy.
I don't see the Project Progress dashboard and my Gantt chart looks different
The dashboard and charts only display as described on this topic if your task values are set to roll up to parent values in your instance.
That is the setting we recommend you use, and is the default in new instances.
However, if you've changed the default, or are using an older instance, you will see each task with an independent estimate. In this case, all task estimates sum to yield the Tasks Est. At Completion that display on the Summary tab.
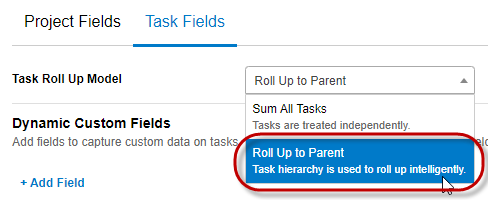
Your administrator can switch the setting so task values roll up to parent tasks. To do this:
- Go to Administration > Project Settings, and click the Task Fields tab.
- From the Task Roll Up Model field, select the Roll Up to Parent option.