What does the Target Billable Hours graph show?
If you bill hours against projects, you may see a Target Billable Hours graph on your My Work page.
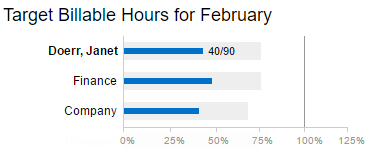
Your billing progress
The top bar of the graph shows:
|
The actual billable hours you’ve entered in your timesheet this month |
||
| The billable hours target that has been set for you for this month |
You can use this graph to track your progress towards your billing goals.
Your groups' billing progress
You may also see other progress bars in the graph. These show how groups you belong to – such as your department, your location, or your entire company – are progressing towards group billing goals. You can use them to compare your monthly progress to that of others in your organization.
These grouped progress bars are calculated as follows:
|
Sum of all billable hours entered by members of that group with targets assigned |
||
| Sum of all billable targets assigned to all members of that group |
If you need more information about this graph, speak to your supervisor.
FAQs
Why are there two Company bars in my graph?
Two Company bars will display if your assigned department is Company, and your administrator has set both your department's and your company's progress to display in your timesheet graph. The top Company bar represents your department's progress, while the bottom one shows the whole company's progress.
Related links
Tracking billable hours against targets
Entering time in a timesheet
Timesheet tour