What does the Progress column show?
A progress bar graph may display on the right end of task rows on your timesheet.
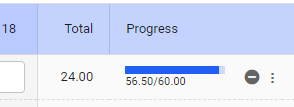
This shows the hours worked / hours estimate for the task. Note that:
- Hours worked by all workers are included, not just the timesheet owner’s
- Hours do not have to be submitted or approved to be included
- Billable and non-billable hours are included
- Hours worked on sub-tasks are always excluded from the total
These graphs can help your team know when you’re approaching estimates. For example, if you have an agreement with a client that you won’t exceed an estimate, they’ll help managers know when they need to re-negotiate. They can also help you find tasks to enter time against in your timesheet.
FAQs
Why do progress graphs only display in certain rows?
In legacy products, these graphs only display in task rows, not in project rows. In the new products, the graphs will display for projects without tasks.
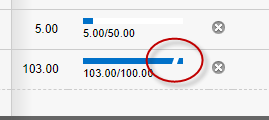
What does the diagonal line across the bar represent?
A slash may display when the hours estimate has been exceeded, depending on what product you’re using.
Related links
What does the Target Billable Hours graph show?
Entering time in a timesheet
Timesheet tour
How do I enter time at the project level, instead of against a task?
Selecting projects and tasks on your timesheet